Why Website Speed Important?
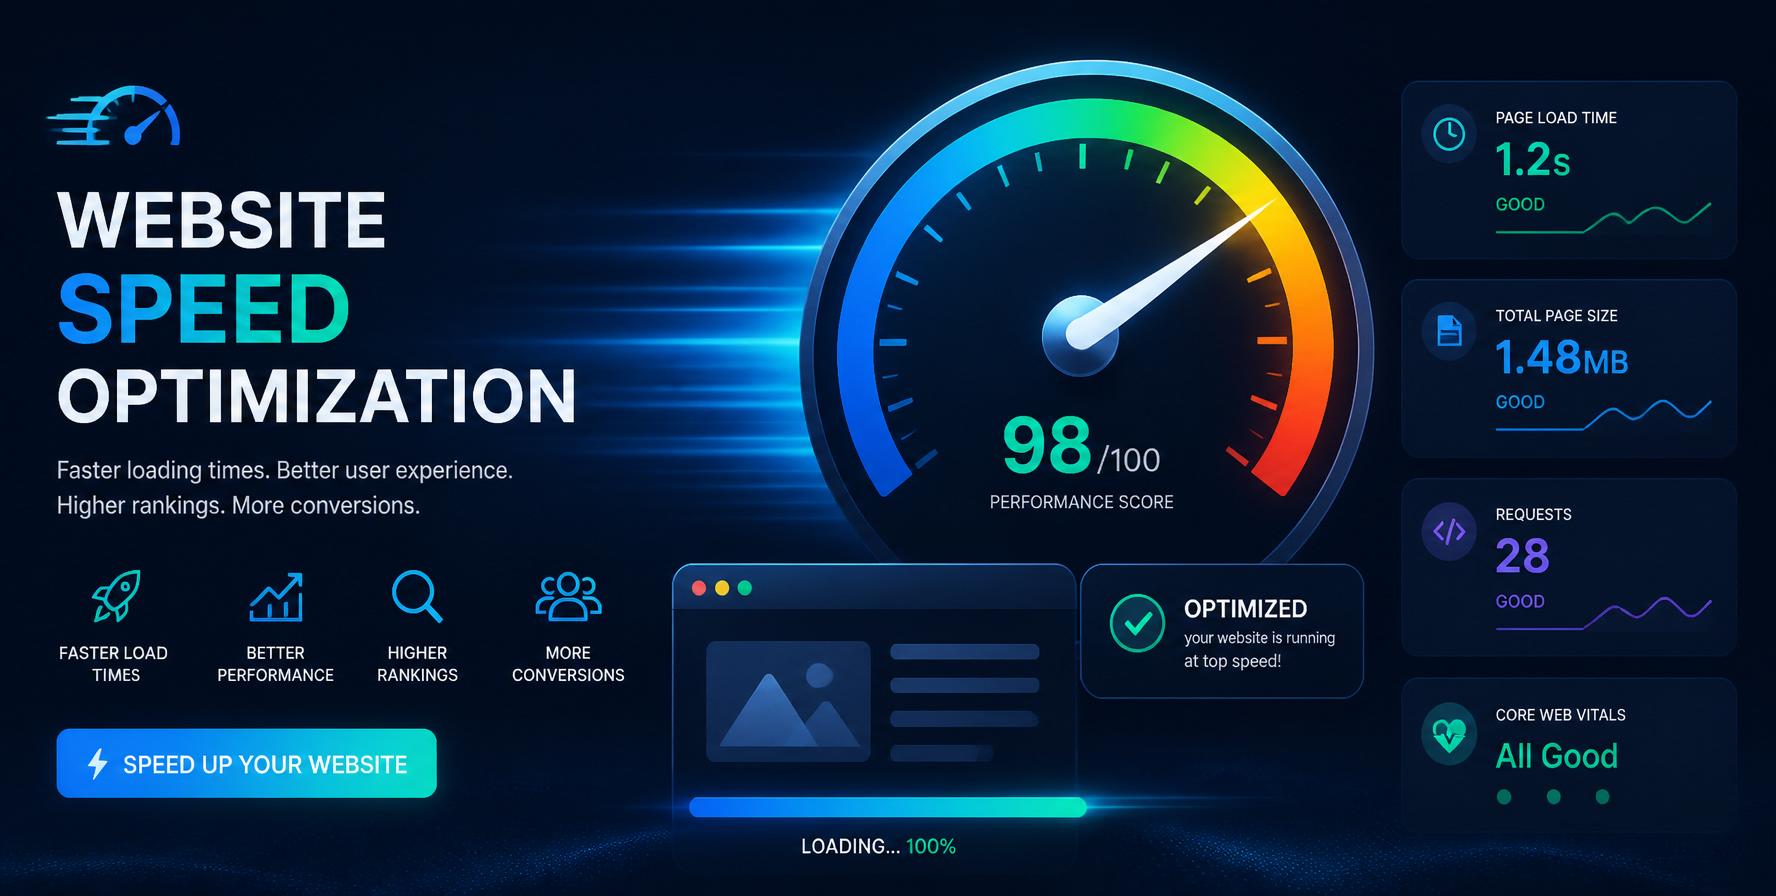
Website speed optimization has evolved from a technical nicety to a critical business imperative. In 2026, speed directly impacts search rankings, user engagement, and revenue. Here's why speed matters:
- Search Rankings: Google uses page speed as a ranking factor for both desktop and mobile searches. Slower sites rank lower.
- User Experience: 53% of mobile users abandon sites that take longer than 3 seconds to load. Speed is UX.
- Conversion Rates: A 1-second delay can reduce conversions by up to 7% — directly impacting revenue.
- Core Web Vitals: Google's Core Web Vitals (LCP, FID, CLS) measure real-world user experience and influence rankings.
- Mobile-First Indexing: With mobile-first indexing, mobile speed is now more important than desktop speed.
In short, a slow website frustrates users, hurts conversions, and damages search visibility. Speed optimization delivers a high ROI across every business metric.
Key takeaway: Speed is not just about technical metrics — it's about delivering a superior user experience that drives engagement, conversions, and loyalty. In 2026, speed optimization is non-negotiable for SEO success.
Understanding Core Web Vitals
Core Web Vitals are Google's performance metrics that measure real-world user experience. They consist of three key metrics that every website should monitor and optimize:
LCP
Measures loading speed — the time it takes for the largest visible element to render.
FID / INP
Measures interactivity — the delay between user interaction and browser response.
CLS
Measures visual stability — unexpected layout shifts during page loading.
LCP — Largest Contentful Paint
LCP measures the time it takes for the largest visible element (image, video, or block-level text) to render on screen. A good LCP is 2.5 seconds or less. Common issues include large images, slow server response times, and render-blocking resources.
FID / INP — First Input Delay / Interaction to Next Paint
FID measures the delay between a user's first interaction and the browser's response. INP (replacing FID) measures overall responsiveness across all interactions. Good scores are 100ms or less for FID and 200ms or less for INP.
CLS — Cumulative Layout Shift
CLS quantifies unexpected visual shifts during page loading. A good CLS score is 0.1 or less. Common causes include images without dimensions, dynamically injected content, and loading fonts late.
Pro tip: Use Google PageSpeed Insights and Lighthouse to diagnose Core Web Vitals issues. These tools provide specific, actionable recommendations for each metric.
How to Measure Website Performance?
Before optimizing, you need to measure. Here are the essential tools for performance testing:
| Tool | Purpose | Best Use Case |
|---|---|---|
| PageSpeed Insights | Core Web Vitals analysis | Comprehensive mobile + desktop scores |
| Lighthouse (DevTools) | Performance auditing | Detailed diagnostics during development |
| WebPageTest | Advanced performance testing | Multi-location, multi-device analysis |
| Chrome UX Report (CrUX) | Real user data | Understanding actual user experiences |
| GTmetrix | Performance monitoring | Ongoing tracking with visual reports |
Best Practice: Test your site on both desktop and mobile, and use real-user data (field data) from Google Search Console's Core Web Vitals report alongside lab data from Lighthouse for a complete picture.
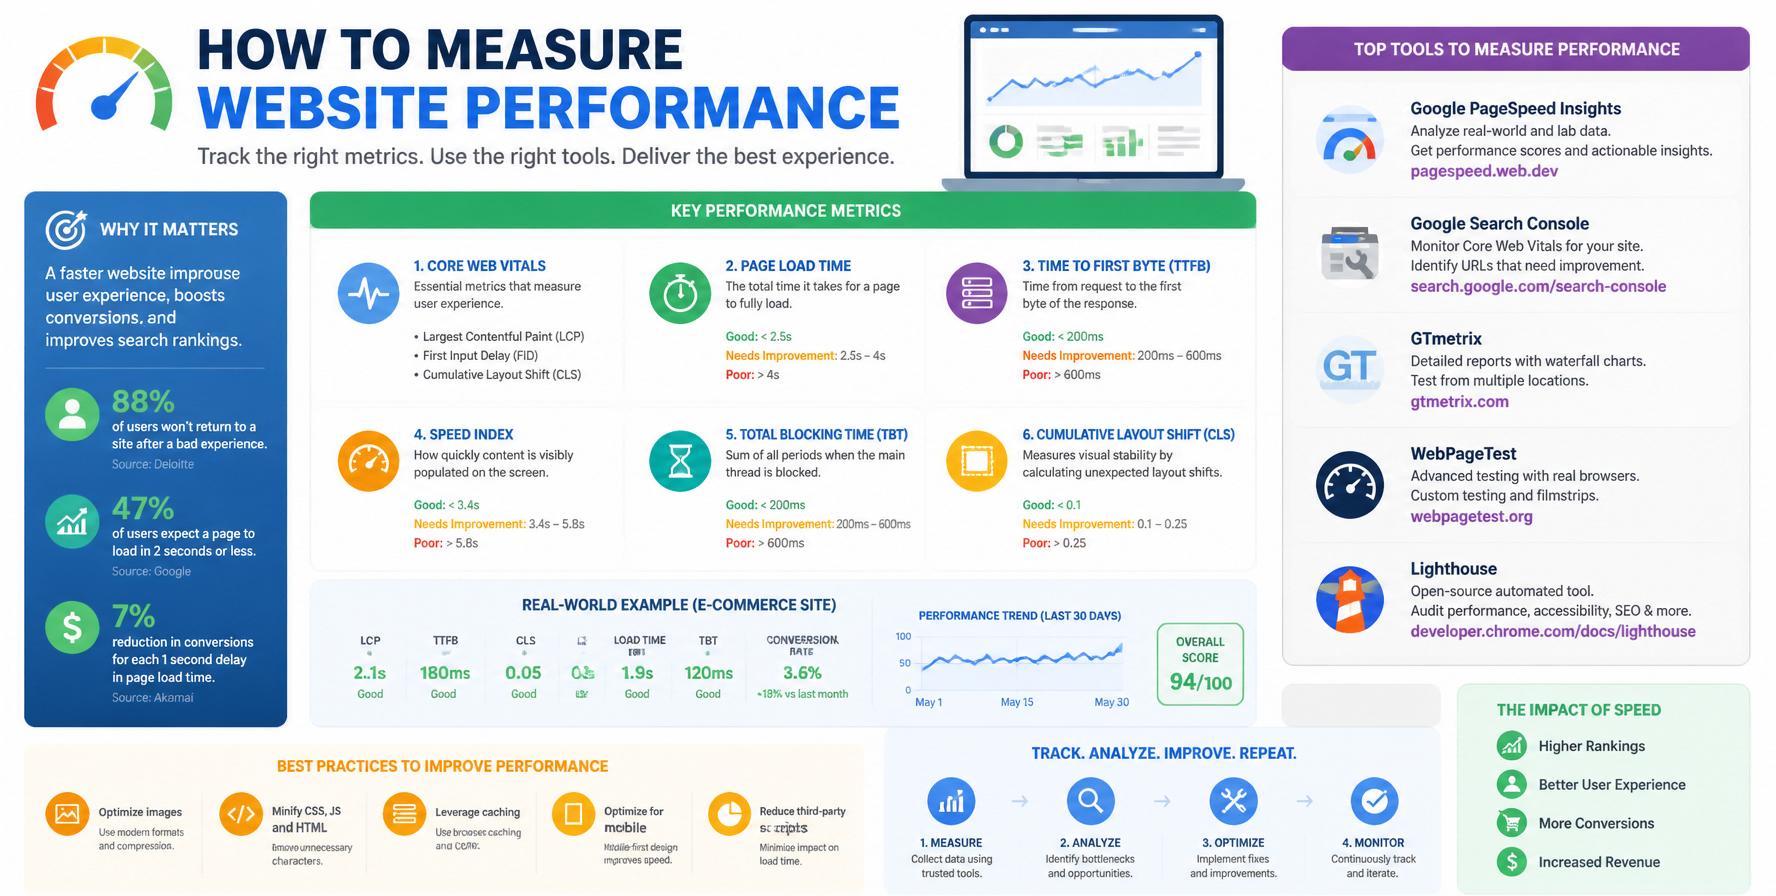
Image Optimization Strategies
Images are typically the largest assets on any webpage. Optimizing them delivers the biggest performance gains:
1. Choose the Right Format
- WebP: Modern format with 25-35% smaller file sizes than JPEG — widely supported by all major browsers.
- AVIF: Next-generation format offering up to 50% better compression than WebP (growing support).
- SVG: Best for vector graphics, icons, and logos — infinitely scalable with minimal size.
2. Implement Lazy Loading
Lazy loading defers loading off-screen images until the user scrolls near them. Use the loading="lazy" attribute on images and iframes for native lazy loading supported by all modern browsers.
3. Use Responsive Images with srcset
The srcset attribute allows browsers to select the appropriately sized image for the user's device, preventing unnecessary bandwidth usage on mobile devices.
4. Compress Images Effectively
- Use tools like ImageOptim, TinyPNG, or Squoosh to compress images without noticeable quality loss.
- Implement automatic image compression in your CMS or build process.
Quick win: If you haven't already, switch your image format to WebP. Most modern CMS platforms and caching plugins support automatic WebP conversion, delivering instant performance gains.
Code & Asset Optimization
Optimizing your HTML, CSS, and JavaScript is essential for performance:
1. Minify CSS, JavaScript, and HTML
Minification removes unnecessary characters (whitespace, comments, line breaks) from code, reducing file sizes by 20-40%. Use build tools like Webpack, Gulp, or WordPress caching plugins that include minification.
2. Defer or Async Non-Critical Scripts
- Defer: Scripts are downloaded but only execute after the HTML is parsed — ideal for non-critical scripts.
- Async: Scripts download and execute as soon as possible, independent of HTML parsing — good for independent scripts like analytics.
3. Eliminate Render-Blocking Resources
Identify CSS and JavaScript that block the initial paint. Inline critical CSS for above-the-fold content and defer the rest using media="print" or dynamic loading.
4. Implement Code Splitting
Code splitting loads only the JavaScript needed for the current page, reducing initial bundle size. Modern frameworks like React, Next.js, and Vue support this natively.
5. Use Browser Caching
Set cache headers to store static assets (images, CSS, JavaScript) in users' browsers. This reduces repeat visits' load times significantly.
Hosting & CDN Strategies
Your hosting infrastructure directly impacts performance. Consider these strategies:
1. Choose Fast, Reliable Hosting
- Shared Hosting: Cheapest but often overloaded — avoid for performance-critical sites.
- VPS: Dedicated resources with better performance — suitable for most growing sites.
- Cloud Hosting: Scalable and performant — platforms like AWS, Google Cloud, or DigitalOcean.
2. Implement a Content Delivery Network (CDN)
A CDN distributes your content across multiple servers worldwide, delivering assets from the server closest to the user. Popular options include Cloudflare, KeyCDN, BunnyCDN, and Fastly.
3. Enable HTTP/2 or HTTP/3
Modern protocols like HTTP/2 and HTTP/3 significantly improve performance through multiplexing (multiple requests over a single connection) and improved header compression.
4. Use Edge Caching
Edge caching stores fully rendered pages at the CDN edge, delivering them instantly without hitting your origin server. This is critical for dynamic content that changes infrequently.
Performance Optimization Checklist
Use this comprehensive checklist to systematically optimize your website:
Website Speed Optimization FAQ
Common questions about website speed optimization answered.
A good page load time is under 3 seconds. For Core Web Vitals, aim for LCP ≤ 2.5s, FID ≤ 100ms, and CLS ≤ 0.1. Every second counts — faster is always better.
Yes, page speed is a confirmed Google ranking factor for both desktop and mobile search. Core Web Vitals specifically measure user experience and influence search rankings.
Use Google PageSpeed Insights, GTmetrix, or WebPageTest. For ongoing monitoring, use Google Search Console's Core Web Vitals report to track real-user data.
Common causes include: unoptimized images, heavy JavaScript, poor hosting, no caching, render-blocking resources, too many plugins, and slow server response times.
Studies show that a 1-second delay can reduce conversions by 7%. For e-commerce sites, this translates to significant revenue loss. Faster sites consistently outperform slower ones across every KPI.
The fastest wins are: optimize images (WebP + compression), implement lazy loading, enable browser caching, use a CDN, and minify CSS/JS. These changes can deliver immediate improvements.
Ready to Speed Up Your Website?
Start implementing these performance optimizations today and see the impact on your Core Web Vitals, user engagement, and search rankings.
Explore All Technical SEO Guides →